Great UX involves interfaces that “just work,” are “intuitive,” and allow for “flow.”
Obtaining a simple experience can be a result of significant thought and planning.
Here, we will explore enhancing user experience and interfacing through the application of human physiology and cognitive models in three distinct areas:
PHYSIOLOGY OF HUMAN PERCEPTION
MAPPING HUMAN VISUAL FIELDS ONTO ANY DISPLAY
PERCEPTIVE SYSTEMS, ICONIC MEMORY AND VISUAL SHORT TERM MEMORY
Additionally presented:
APPENDIXES containing information about applying visual theory in practice
SOURCES containing an thorough collection of citations for the science
APPLICATION SIDEBARS that implement an interface or study design
For a full table of contents, please see below.
Contents
- 1 PHYSIOLOGY OF HUMAN PERCEPTION
- 2 MAPPING HUMAN VISUAL FIELDS ONTO ANY DISPLAY
- 3 PERCEPTIVE SYSTEMS, ICONIC MEMORY AND VISUAL SHORT TERM MEMORY
- 3.1 Interfaces and the Flow State
- 3.2 UI/UX and the Speed of Thought
- 3.3 A quick primer on human memory systems
- 3.4 Saccades, memory, and interface timing
- 3.5 Working memory and networked knowledge
- 3.6 What you see is not what you perceive
- 3.7 Peripheral interfaces and lateral interference
- 3.8 How close is too close?
- 3.9 Visualizing crowding
- 3.10 A summary of applications
- 4 Closing considerations for the future
- 5 APPENDIXES
- 6 SOURCES
- 6.1 Iconic Memory and Visual Span topics
- 6.2 Physiology of the Eye
- 6.3 VSTM
- 6.4 Cognitive perception
- 6.5 Audio memory and phonological loop
- 6.6 Flicker Fusion Thresholds and Visual Phenomena
- 6.7 Smooth Pursuit Topics
- 6.8 Saccade Topics
- 6.9 Perceptual Speed Topics
- 6.10 Memory Topics
- 6.11
- 6.12 A word of caution on accepting results at face value
PHYSIOLOGY OF HUMAN PERCEPTION
In this section, PHYSIOLOGY OF HUMAN PERCEPTION, we will be primarily concerned with the retina and anatomical structures that interact with it. We’ll work through physiology to derive fundamental drivers of why users to perceive or fail to perceive aspects of user interfaces.
In the subsequent section, MAPPING HUMAN VISUAL FIELDS ONTO ANY DISPLAY, we’ll show how to prepare Acuity Maps and project them onto any display, regardless of size, distance, or position, and how to reconcile interface sizing across a variety mobile and desk-driven environments, including thumb and cursor interactions.
In the final section, PERCEPTIVE SYSTEMS, ICONIC MEMORY AND VISUAL SHORT TERM MEMORY, we’ll explore the entry of user interface information into our perceptual, emotional and cognitive awareness, how and why interface elements enter working memory, and what structures inhibit or enhance user learning, including the acquisition of reflexive memory.
The complete series of sections represents a journey through human perception, cognition, and memory formation to understand what makes great interfaces great through the lens of human physiology.
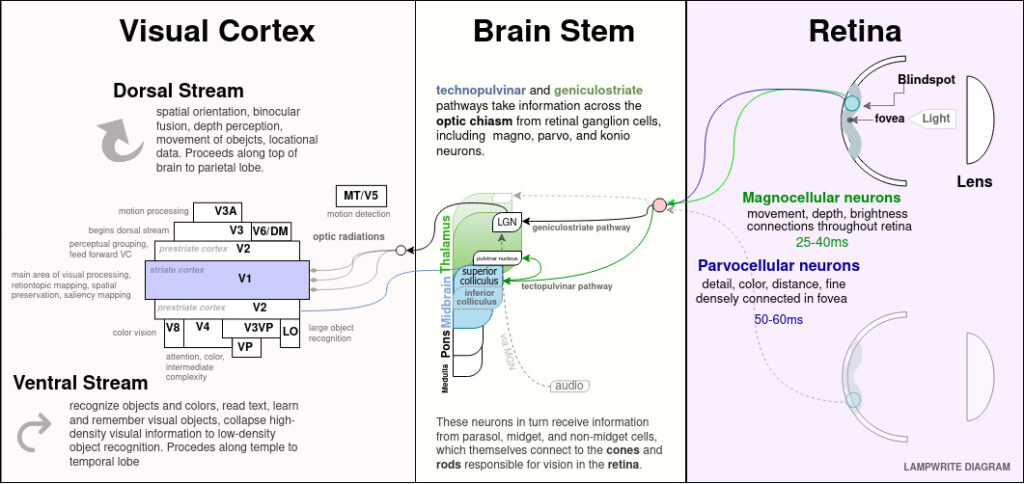
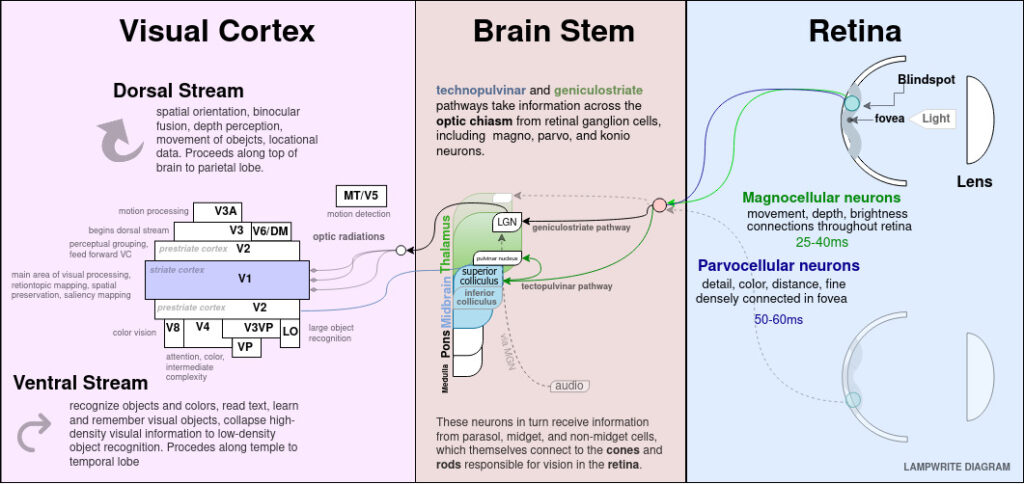
As a thorough deep-dive into human perception for interface design, we’ll map the perceptive experience all the way from the actual structures of our eyes, through neural complexes in our brain stem, into the visual cortex of the occipital lobe, and then throughout our memory-forming and attention-directing structures in the prefrontal cortex.
We’ll talk about the limitations and strengths of each system, and how these capabilities inform broader design choices.
Physiology, blindspots and visual acuity shape UX requirements
The physiology of the human eye is to visual interfaces what the hand is to physical tools.
Ideal element sizing, overall layout, framerate choices in animation, color and contrast optimums and ideal refresh rates are direct outcomes of human physiology and the display they are interacting with.
A brief primer on the anatomy of the eye and human visual capabilities
If our eyes can’t see something, it limits our ability to interact with or absorb content.
Major perceptual limitations in human vision are blindspots and the loss of acuity from foveal to peripheral vision.
Blindspots are points on our eyes where we have no actual ability to see the screen. Both eyes possess blindspots to the left and right respectively of the center of our eyes.
Blindspots are the common causes of users “missing” a requirement or action.
We don’t perceive these blindspots under normal conditions, because our brains subconsciously “fill” them with adjacent patterns and color, just as most people don’t notice the shadows left by blood vessels and other structures in the eye because our mind subconsciously discards them.
You can examine the effect of blindspots on yourself through a relatively simple process of a piece of paper and a tape measurer, detailed further on.
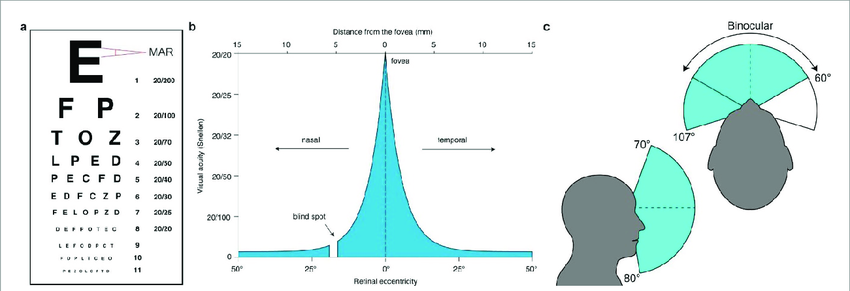
Acuity refers to how clearly we can see objects or letters and varies across our visual field
Many people think of themselves as having relatively consistent quality of vision across their visual field.
Only a narrow portion of our central field of vision can see at maximum visual quality (20/20 or , with a limited awareness that our peripheral vision might be a bit more limited.

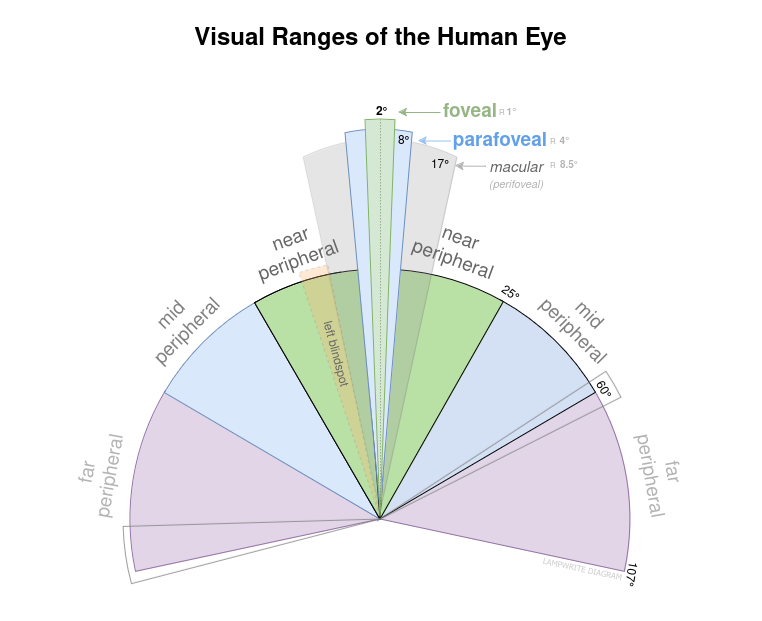
Observe the diagram above, which somewhat exaggerates the effect.
Foveal vision is sharply limited to 2 degrees of our field of vision. At the typical distance of a phone or desktop screen, only about 3/4 of an inch is contained within foveal, and visual acuity and falls off sharply.
The human brain creates the illusion of a larger normal visual span by consciously and unconsciously moving the center of vision into any area of interest in the field of view through saccadic motion.
Visual acuity and design deadzones
Starting with foveal vision and blindspots provides us significant insight into perception.
For simplicity and relevance to the user experience, we will refer to visual ranges:
- the first diameter of 2° of vision as foveal vision;
- the second diameter of 8° of vision as parafoveal vision;
- and generally vision from 8° to 17° as macular (perifoveal) vision;
- and everything outside of that as peripheral vision
The left eye blindspot and the boundaries of the nasal and furthest temporal peripheral area are also referenced. The right eye blindspot is simply reversed.
In all three portions of this article, we’ll analyze matching or meeting a physiological aspect of human perception.
However, on some occasions, we want a user to break expectation and mental flow
– such as pausing before irrevocably deleting something of value
– to prepare a user for maximum impact of subsequent information
– allowing a distractor that is not salient to the current task to be culled from VSTM
Our eyes are structured to handle visually tracking distant objects and close up detailed work with our hands.
How we interact with the world when such a significant portion of our visual capacity is unavailable or degraded outside of a narrow window is worth reviewing.
Our perception relies on a complex series of systems to feed us the most useful information at the right time. We’ve omitted mention of several ones not relevant to stationary UX (such as the camera-stabilizing effects of the vestibulo-ocular reflex) and focused on the ones with the largest impact to most fields of screen-based user experience design.
Iconic Memory
Iconic memory is a short duration, high capacity, rapidly decaying memory store. It is fed by a massively parallel neural network of retinal ganglions that feed through our midbrain and thalamus to our visual cortex. The retinotopic projection maintains and consolidates a strong visual representation that is acted on by a number of systems. The visual component of iconic memory endures in a range 150 ms, and the informational component that has been consolidated to distinct objects lasts between 250 ± 50 ms.
Saccades
In order to read text or engage with larger content, the eyes must move, typically through saccadic motion. These are short, ballistic eye movements, and unless a human being is consciously fixating on a point, they occur consistently to update our field of vision with points of interest. Saccades, like any sharp movement of a visual system, result in blurred images that are suppressed automatically and filled with information from the visual short term memory.
Saccade movements are fast (20-40 ms in duration) but slow to initiate against new visual stimulus at more than 100 ms. Microsaccades and reflexive saccades can exhibit quicker initiation cycles.
Perceptual Span
Our perceptual span uses cues from parafoveal vision and our iconic memory to produce a greater visual span before our eyes must move to read.
For western alphabets, this is 4-5 characters to the left of fixation and less than 15 characters to the right. Perceptual span size, directionality, and capacity is highly task, language and training dependent.
Similarly, perceptual span sizes exist for faces and other objects in different sizes and shapes.
Perceptual span is plastic and increases in capacity from adolescence to adults.
Experts of any field possess a greater perceptual span for objects of their field, leading to a disparity between interface design optimized or designed for an expert’s comfort as compared to a novice’s comfort.
Light Differentiation
The foveal arc provides us with not only our most acute vision, but also our least distorted vision. Light rays are subjected to minimum of scattering due to the thinner layers of cell bodies, and blood vessels do not typically overlie the foveola. Our ability to perceive shifts in tone and apparent lightness are highest within that central 2 degree arc. This has important impacts on tool design for creative, some entertainment, and educational based workflows.
| Two columns of text are more common in wide format magazine printing and academic contexts. |
Achieving a two column layout is more complex in web contexts, but sometimes viable. It’s more typically done as an aside to a presentation of a visual context.
Sometimes, it can be the correct layout for particular applications. Drawbacks include less scanability, increased focus requirements, and possible user confusion.
In a physiological sense, two-column printing has much more to do with the advantages of the width of the content (3 to 3.5 inches) than it does with the fact there are two columns, although this plays a role.
These width benefits arise out of a user’s natural perceptual width and saccades.
Keeping the primary content within a 3.5 inch range reduces eye movement. Mobile readers read at this width.
Unfamiliar or novel content also reduces a user’s perceptual span, so placing this kind of content into a two column layout can further enhance readability.
Feature detection, contour perception and various masking processes, discussed in the PERCEPTUAL SYSTEMS, govern the mental cost of two column layout, and tell us why making the second column a certain type of visual can be useful.
Blind spot locations
Vertebrate eyes have a blind spot where the optic nerve passes through the optic disc.
In humans, this is located about 12–15° away from the temple and 1.5° below the horizontal. The blind spot is roughly 7.5° high and 5.5° wide.
On a computer screen 24 inches from you with your right eye closed, your left eye has a blind spot 6.3 inches to the left. It is approximately a 2.5 inch x 2.3 inch spot.
The right eye has a similar blind spot to the right.
Both blind spots are about 5/8ths of an inch below your horizontal gaze.
Steps for finding your blindspot
One simple test involves a blank piece of unlined paper and a marker:
- On the piece of paper, draw an O on the left side and an X on the right side.
- Put your right hand over your right eye.
- Hold the piece of paper in your left hand at arm’s length.
- Focus your left eye on the X.
- Keep focusing on the X, and move the paper toward your face.
- When you can’t see the O, you’ve found the blind spot in your left eye.
Handling the blindspot in UI
Placing important UI or content elements in a user’s blind spot may reasonably cause some friction in usage of a given interface.
We don’t typically notice our blind spots, because the human visual system automatically “fills in” or interpolates the surrounding image over the blindspot.
A letter marked on a page in our blind spot will simply appear as a blank area with no markings. If support requests are returning a high rate of “I didn’t notice the icon”, check on blind spots.
Blind spots, line height and content width
For reading, blind spots can interfere with saccade reading by obscuring the next line.
If your line height would place a next character 0.625 inches below the first line, pay close attention to the width of your text, or place elements or contours outside of the blind spot that guide a user to their next line.
Keep this value in mind for both next lines and paragraph breaks. Elements larger than the blindspot will remain visible.
Leverage blind spots in UI design to reduce clutter.
Establish a blindspot threshold in vertical columns in your design, rather than trying to predict the precise location. Blindspots will vary based on physiology, how close they sit to the monitor, and the present location of their fixation.
Place elements that do not need to be consulted during their main activity loop either just beyond a blindspot threshold or out of frame.
Horizontally, at 24 ” from the screen (an average desktop working position, important for business and deep creative software) this is the area beyond the fourteen central inches of the screen.
Blind spot ranges can be calculated for all screen types and usage patterns. Two monitors are an excellent example of how humans interact with content from “beyond the blindspot threshold,” as are the toolbars in photoshop.
MAPPING HUMAN VISUAL FIELDS ONTO ANY DISPLAY
Applying anatomy to interface sizing
Previously, we might rely on a “rule of thumb,” when evaluating interfaces for UI deadzones, and we could say that foveal vision is a thumb’s width and parafoveal vision is a hand’s width, when the hand is held at a distance mostly in line with the shoulder, one degree below the horizontal gaze.
More usefully, we can calculate the width for a screen at various distances through the following:
$$2 * \tan {angle\space \theta \over 2} * distance$$
Which has been simplified as a table here:
| Vision | Formula | 8″ | 12″ | 24″ | 30″ |
| Foveal vision (2°) |
0.035 * distance | 0.28″ | 0.42″ | 0.84″ | 1.05″ |
| Parafoveal vision (8°) | 0.140 * distance | 1.12″ | 1.68″ | 3.36″ | 4.2″ |
| Macular vision (17°) |
0.30 * distance | 2.4″ | 3.6″ | 7.2″ | 9″ |
| Near peripheral (50°) | 0.93 * distance |
7.44″ | 11.16″ | 22.32″ | 27.9″ |
| Vision fully between blindspots | 2*(x-w/2) | 3.51″ | 5.15″ | 10.32″ | 12.9″ |
| Blind spot 1.5° y 12–15° temporal 7.5° high 5.5° wide. |
0.026 y 0.263 x 0.131h 0.096 w |
-0.28″ 2.14″ 1.05″ 0.77″ |
-0.31″ 3.15″ 1.57″ 1.15″ |
-0.62″ 6.31″ 3.14″ 2.3″ |
-0.78″ 7.9″ 3.93″ 2.9″ |
Mobile phones are typically held between 7 and 14 inches from the face, and unlike laptop and desktop screens, are easier to move to the correct location for a user’s current needs.
When held vertically, about half the screen is within the macular vision field. Any given point of fixation within foveal vision represents less than 1/112th of the screen area. Parafoveal vision will contain less than 1/6th of the screen, and half of the screen will reside in the macular visual arc.
This allows us to have a simple drop-over to check for deadzones on any given design for any device in any condition. More detail about applying these techniques are provided in the APPENDIX.
Let’s explore the ability to “drop check” an acuity map onto different displays.
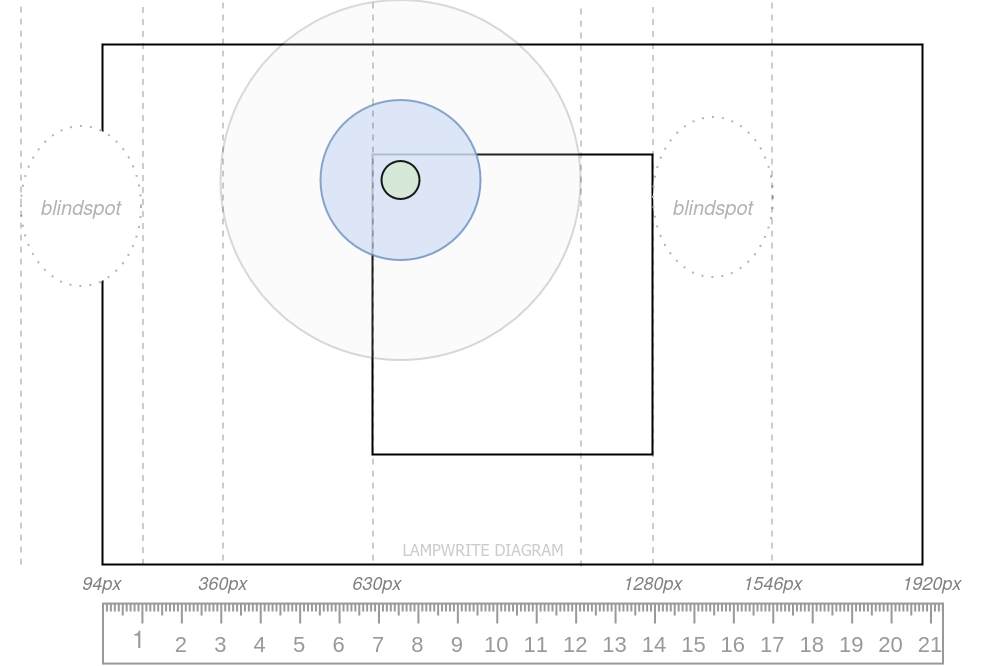
Blindspots, foveal and parafoveal vision on mobile
Foveal vision (central 2 degrees) is marked in green.
Parafoveal vision (central 8 degreees) is marked in blue.
Macular vision is the larger gray circle.
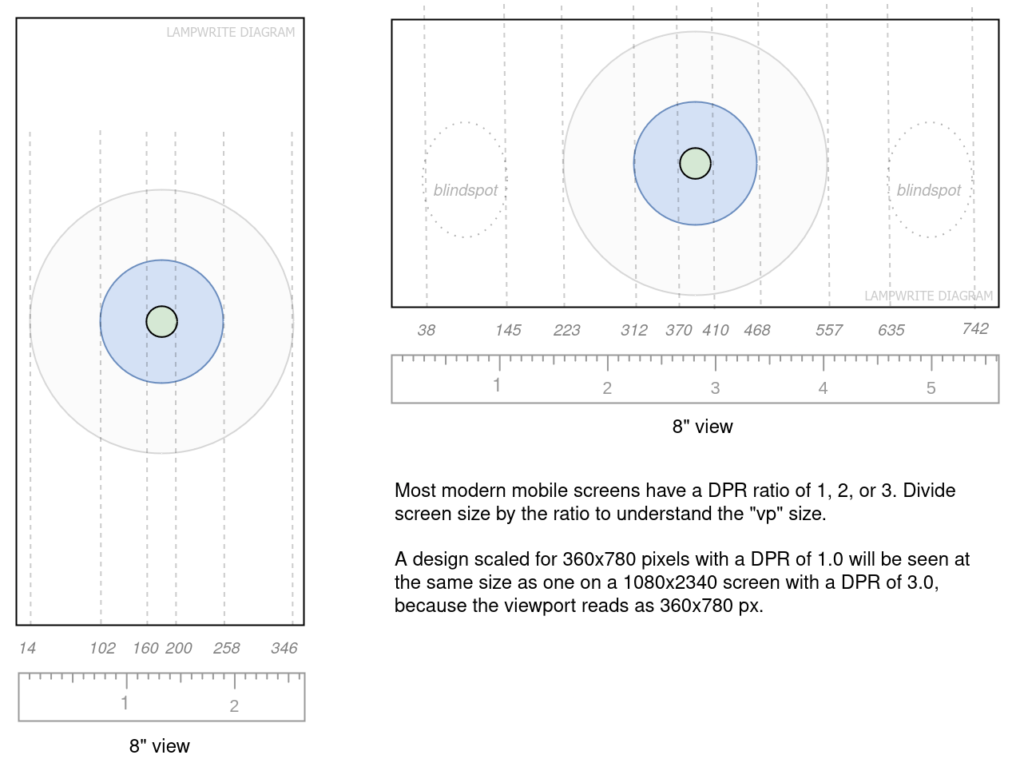
Here we can see that, once DPR is taken into account, where ideal deadzones for interaction points show up in landscape view, and the ideal hotzone size for attention-focused content is in portrait.
 Designing for Touch (Chapter 1, Josh Clark, alistapart) – right handed thumb zones
Combining an acuity map with a map of the thumbzone helps identify prime areas for content, easy-reach icons and action-termination zones.
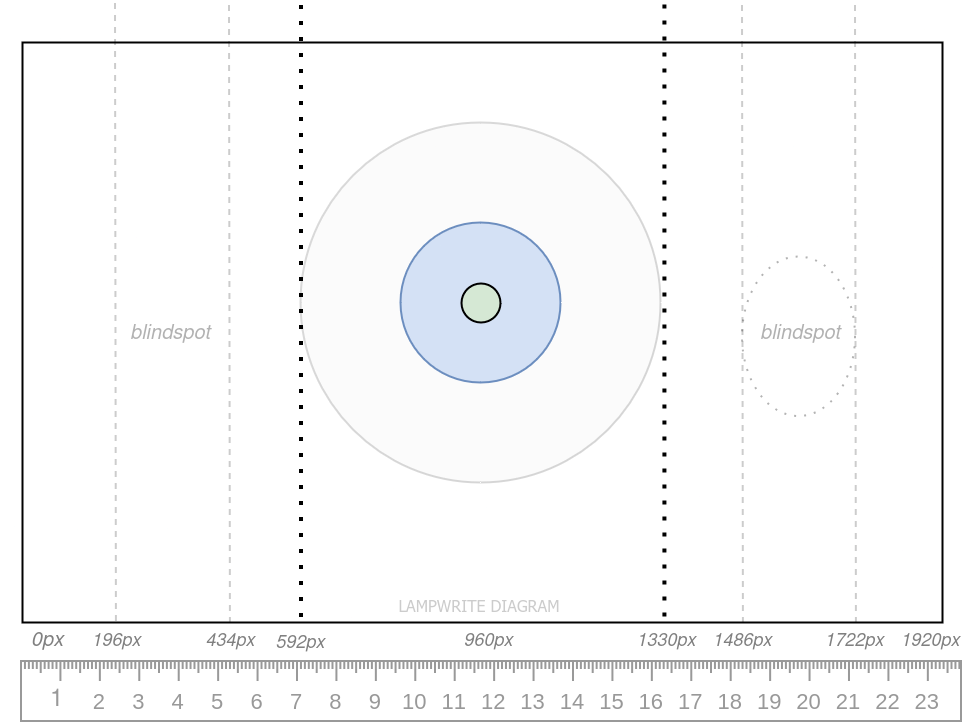
Blindspots, foveal and parafoveal on desktop
Laptops used normally typically sit 16″ to 20″ from a user’s eyes.
Desktop environments, most relevant to interactive, business, and creative work, typically reside 24″ to 30″ from a user’s face.
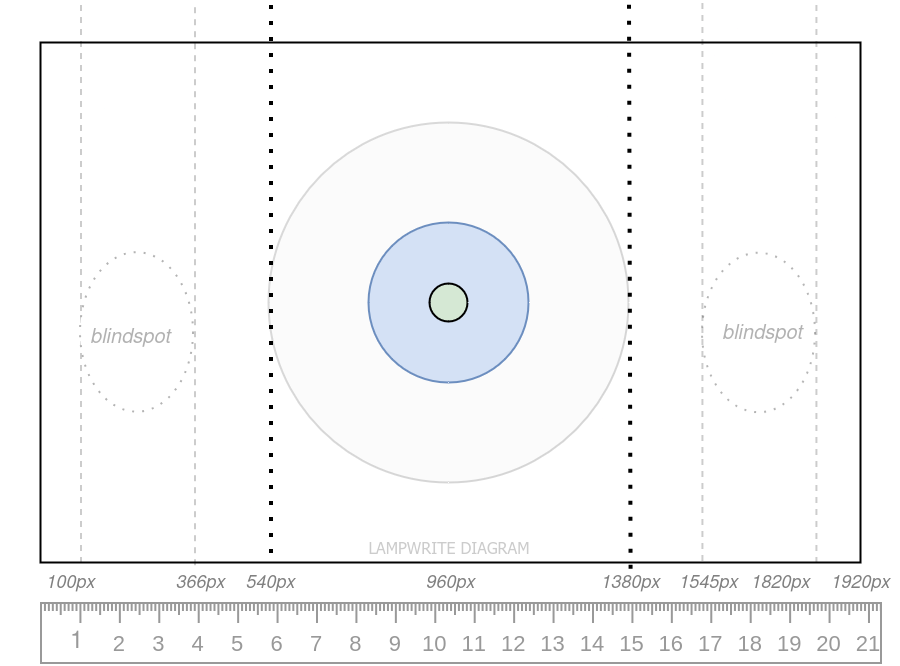
At 30″ from the screen on a 24″ monitor in with the gaze fixed centrally, we can see the the columns where blindspots fall and the maximum extent of macular vision.
Foveal vision is about 96 pixels wide.
Parafoveal vision is about 385 pixels wide.
Macular vision is about 826 pixels wide.
The further a user sits from the screen, the smaller the visual fields become.
At 30″ from the screen on a 27″ monitor
At 30″ from the eye, foveal vision was about 96 pixels wide on a 24″ screen.
On a 27″ screen as above, it’s 85.6 pixels.
However, users naturally adjust the distance they sit from the screen to match their visual preferences. Moving backwards by 3.5″ will closely match the visual acuity achieved on the 24″ display to the 27″ display.
Thankfully, 24″ to 27″ displays scale consistently for central focus tasks.
Strategies for Centrally-focused content on the Desktop
- Consistency. We can reduce how often a user needs to adjust position to view the content. Within the desktop view, if we identify and design for a median set of thresholds, subject to realistic minimum and maximum levels, we can avoid this.
- Ergonomics. Our designs can be structured to permit users to sit comfortably and hold the device in a consistent area through the use of acuity mapping.
- Blindspots. Elements in blind columns are frequently missed and increase saccadic movement misses. Blindspots can be left empty or we can repurpose them hold contextual information not relevant to the current gaze task.
- Foveal acuity. Foveal vision is highly effective for small, delicate tasks, including painting and manipulation of items.
Interactions that require foveal vision are tightly constrained in viable size.
Shrinking a small manipulation task beneath a certain size makes operations challenging.
Additionally, enlarging small manipulation tasks beyond a user’s foveal vision reduces user accuracy, including vernier acuity (ability to detect discontinuities), grating acuity (determination of angle), and color differentiation.
Even a small distance reduces clarity from 20/20 to 20/30 – enough to need a second prescription! At 6 degrees, acuity is reduced by 75%.
For creative or workflow intensive tasks, including spreadsheets and columnar data, management of the foveal arc and iconic memory can be key to a smooth workflow experience.
- Cover less than half of the foveal space (smaller than 48px for desktop) when a cursor or small interaction handle is present so that they do not obscure the focus
- Use interaction handles have at least 12px (similar to a character) of clickable space that does not overlap (for desktop mouse; 16px on a laptop touchpad)
- Introduce excess handles in a contextual manner if they would exceed the viable space within the foveal vision, either under a sub interface or modifiable by a secondary action, such as how we move the cursor with arrow keys when typing
- Make use of the decrease in acuity and brightness drop-off in parafoveal vision to provide gaze-intensive tasks with place-finding context in greater detail with lightly-shaded controls and contours, such as grids. Visual crowding and contour interference can be suppressed through carefully selected gradients and color palettes.
Application purpose alters optimal vision
Centrally-focused activities (education, visual creation, foveal interactives, and video) rest the user’s gaze at the screen center, with sporadic glances outside of the work area.
Saccadic-intensive activities, as depicted above, include reading, analysis, table manipulation, and many business or scene-related tasks where a user scans over a definable area.
Gaze fixation on a column of readable content will result in new blindspot patterns and move the best locations for context and functional peripheral space.
Design paradigms such as “left monitor edge for frequently accessed actions or content” in a reading or editing environment places the actions within the blind column of the user.
By using the left monitor edge for “switch/end” or infrequent activities, where an interaction sequence has come to a close, we can maximize space for placement of a primary toolbars (e.g, bold, italics, in editing) within macular vision.
Finally, adding more than three ‘offside’ contour areas, for reasons that have to do with working memory and LTM that we explore in the next section, increase the minimum expertise (or learned reflexive familiarity) required to use the tool to its fullest extent.
PERCEPTIVE SYSTEMS, ICONIC MEMORY AND VISUAL SHORT TERM MEMORY
In this section, we’ll examine how we translate the retina’s visual signals into conscious recognition, thought, and working memory, allowing a user to recognize, interact, and internalize interfaces.
Interfaces and the Flow State
Flow is described as a state of optimal performance denoted by smooth and accurate performance with an acute absorption in the task.
The idea of flow states stem from research in behavioral science and psychology, and are well described by Csikszentmihalyi. Their application is widely understood in creative fields, technical undertakings, complex writing or content creation, and administration of complex data.
In the context of UX performance, we’re interested in the following aspects of the state:
- Users have a high degree of productivity
- Performance of tasks is autotelic and rewarding
- Users can have strong focus and concentration
The ability for an interface to flow smoothly hinges on interactions between the mind, the interface, and the mind’s grasp of the task it is performing.
UI/UX and the Speed of Thought
Humans can perceive things quickly and find relevant information at surprising speeds. This speed is an essential aspect of smooth flow.
While a visual signal might arrive at a brisk 25-40ms at the brainstem, perception can pick up on details of much shorter duration.
Recognition of images can occur even if exposed to an image for as few as 13 ms, if the object is visible within sharp central vision. This is an example of how physiology ultimately sets the limits on expectations. While Media Pacing has varied over the years (many popular genre styles from even 40 years ago feel slow today) there is an upper limit to our preferences set by our eyes, and likely, a lower limit set by our ability to focus. Similarly, we also know that a collection of low resolution assets or grayscale content is harder to recall when displayed in a time task.
Perception of the illusion of motion for humans is able to occur at low rates, often as low as 16 frames per second (62.5 ms) – in part, because we have advanced visual buffers and processes that condense motion and objects into emotion. Some birds, by contrast, do not begin to perceive the content of video feeds as something other than a series of static images until the frame rate exceeds 75 frames per second (13.3 ms).
Perception of darkness occurs so quickly that even a single dropped frame amongst hundreds is perceptible. Despite being able sustain the illusion of motion at modest framerates, the perception speed of changes in luminosity for darkness or light are why graphics cards began to receive memory in the first place – far before parallel processing – in the form of frame buffers. It’s also why layout reflows are more visually disruptive when the content has higher contrast. Some humans can notice dropped frames in as few 1 in 500 fps, or 2 ms, and most humans will notice at 18 to 22 ms. Variance in human ability here describes a part of why certain displays and lighting systems, at lower Hz thresholds, induce eye strain in some humans but seemingly not in others.
Smooth pursuit, once initialized on an object, is why human eyes can track and catch fast moving objects. Smooth pursuit is a mode of eye movement distinct from Saccadic eye movement, which updates too slowly to capture quickly moving objects. Tasks involving object tracking (in particular, interactive games and educational content, but also creative activities like painting) are likely to preferentially benefit from higher framerates than film.
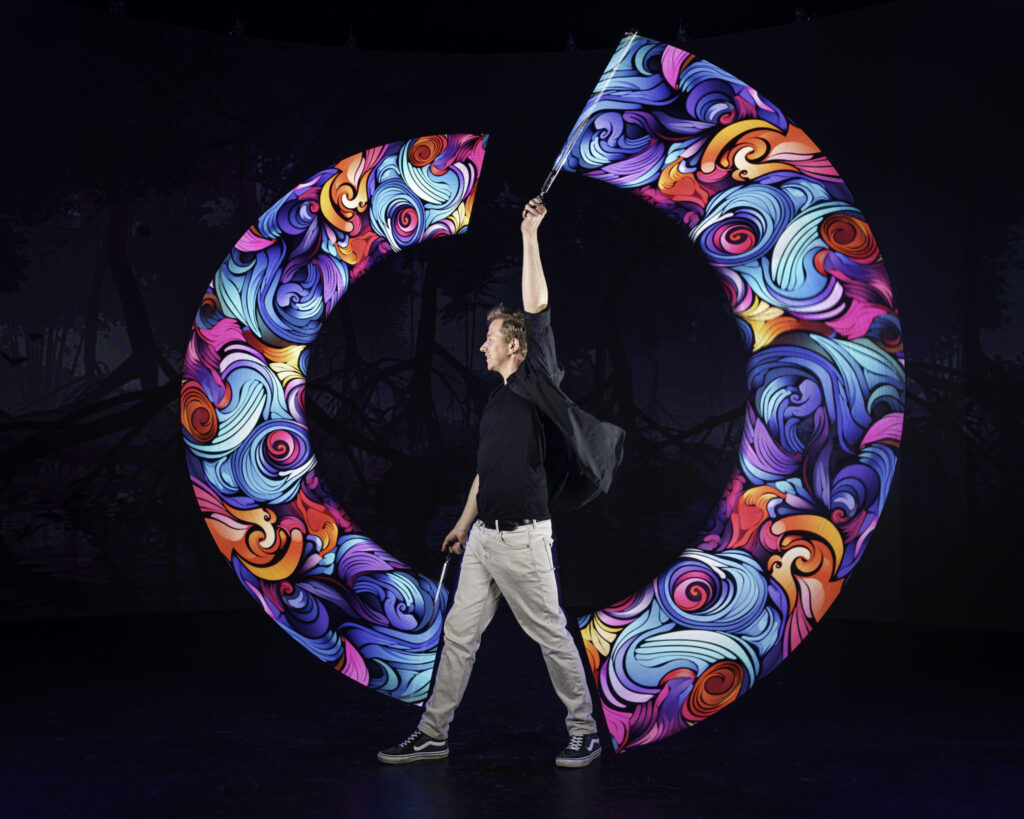
Just as video cameras can sometimes synchronize with a rotating fan so that it appears motionless on video, human eyes can be exposed to a carefully timed series of color flashes on a rotating stick that leave behind the illusion of a large shape.
Flicker Fusion in action: above we can see a poi spinner rotating an LED stick to create the illusion of a solid shape. This photo has been retouched for contrast, but the effect (simultaneous appearance of a complex visual of a circle originating from a moving tube of light) is plainly visible in real life, thanks to flicker fusion and timing.
A quick primer on human memory systems

To understand the impact of saccades, a quick primer on visual memory is valuable.
We can roughly consider a model of working memory in the following steps:
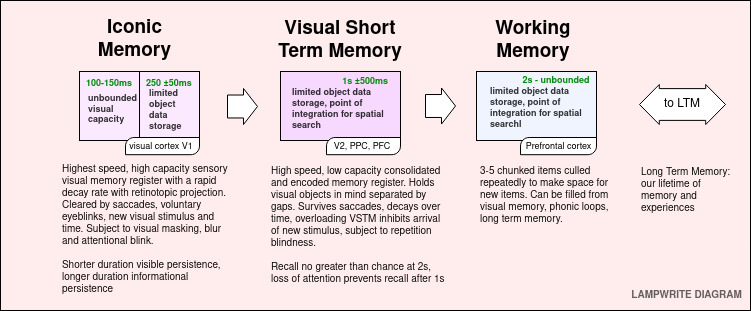
Iconic Memory, an extremely short duration, high bandwidth and high capacity store
Visual Short Term Memory (VSTM) – an intermediate cache of bound, salient visuals
Working Memory – a chunked item space containing items related to our current task
Saccades, memory, and interface timing
Here is an eye in saccade movement as it looks freely at an image. Note the sharp, ‘ballistic’ movements.
The video was recorded using an infrared video-camera at the Pupils lab for Neuroscience, Tuebingen, Germany.
We’ve explored how blind spots and the nature of sharp central vision affect layout.
Next, we’ll examine the saccadic system in detail, and apply the limitations and capabilities of the human eye system interacts with interface design.
Along the way, we’ll consider saccades and how they fill, clear, retrieve from and update our visual memory.
Saccades are ballistic, ‘preprogrammed’, voluntary eye movements, meaning that the desired result of a new eye position is translated into a command, not dependent on feedback. Therefore, saccade speed is not under voluntary or visual control, but depends on the calculated size of the movement.
We cannot interrupt a saccade once it has begun, and cannot change course mid-movement.
Although almost all reading is done by saccadic movement, rather than visual fixation or smooth pursuit, a saccade over a greater distance (10 degrees) causes an especially strong loss of visual acuity during the movement. Just as our visual system “paints in” blindspots and removes the shadows of blood vessels from our vision, it also removes the visual blur accompanied by high speed movement, but that does not mean that our VTSM retains complete accuracy regarding the location of other items.
By confining likely saccadic movement to predictable areas, we can enhance a user’s ability to process information.
Corrective saccades that fire when missing a return to a reading start introduces further delays, and once initiated, eyes in saccadic movement cannot update their movement until the direction is complete. If it happens repeatedly, we introduce multiple 100ms delays before a user engages in content!
The concept of the “F” and “Z” patterns in web design trace their consideration to gaze-tracking measurements of saccadic movement. However, it is the purpose of each fixation and the interaction of gaze that can be best understood through a deeper analysis.
Scrolling, memory, and visually guided eye movement
Scrolling or orientation changes not under the control of the individual will distort memory guided saccades and interfere with visual processing of the user. A list that scrolls in a clearly linear fashion reduces the complexity of tracking motion.
If the interface is not memorized and currently in their working memory, a user must rely on visually guided saccades. An attention drawing aspect should be employed when a user must learn to transition their gaze to a new area after an action.
Jumpy visuals are hard to follow because of the inability to update a saccade until it is completed, and a new one is located. Animations should be smooth.
It is notable in that allows us to offload animation cycles when the content is considered by a browser not to be visible, and to perform an animation at the next available cycle for animation. This can, but not always, leads to smoother animations and less resource contention, but it can also lead to large ‘jumps’ forward in the animation stack under unfavorable scenarios.
Because a jumped animation over a significant distance will likely result in multiple saccades (functionally, clearing both the user’s iconic memory and losing the coherence of their short term visual memory) as they initiate search for a lost icon or cursor, we can consider that there are circumstances where an animation could prioritize eliminating the rarer large jumps over modest performance gains.
This is especially worth considering in the context of functional animations, meant to guide attention across a greater region, and failure of execution could disrupt the learning process.
Vertical, horizontal and diagonal eye movements
Horizontal and vertical saccades are actually projected by different parts of the brain. and controlled by separate motor systems. The horizontal saccades are mediated by PPRF. Vertical saccades are governed by the rostral interstitial nucleus.
We naturally use both simultaneously, but linear movement has a higher accuracy. If content is important and the distance moved diagonally is high, ensure the diagonal ends are sufficiently visible in the periphery and understand the diagonal may skip over the content without fixation.
Our perceptual span is the maximum width of perceivable space within a fixed gaze, and a combination of the sharp central vision of the fovea (about 2 degrees) and the parafoveal space and some of the periphery (about 4 degrees).
Perceptual Span when Reading
For a screen at 24 inches away, that’s 2.5 inches in width; at 10 inches, it’s 1 inch.
This shape is not symmetrical when reading. The first 4-5 characters to the left of the point of fixation and the next 11-15 characters to the right are within the perceptual span.
If a word does not begin or end within 7-8 characters of the perceptual span, they will be unable to fully recognize it. This factor, combined with observations that perception span when reading is smaller for less practiced readers, makes 14 characters a safe design threshold for phrasing intended to hit iconic memory.
Microsaccades allow a user familiar with the language and phrases in use to pass through a greater amount of content.
Icon complexity reduces perceptual span
Icon complexity, including for written languages, decreases the perceptual span. Simplified letters have similar perceptual spans of about 20 characters, whether they are English, Finnish, or Uyghur. Tibetan falls to 11 characters, Simplified Chinese to 5 characters, and Traditional Chinese to 3 characters.
Icon familiarity reduces perceptual span
Icons that are unfamiliar to a user reduce perceptual span. Any new icon set that is not part of a user’s reflexively learned experience will reduce familiarity. Contrarily, a lack of familiarity with an icon will cause it to stand out a greater level and may increase recall, especially if it interrupts a set length of similar items.
Working memory and networked knowledge
Working memory is what allows us to complete tasks involving multiple information.
It’s important to note that Working Memory can be loaded with non-visual items, and filled from current perception or from Long Term Memory, which allows us to process new information and correlate it with past information.
Concepts like chunking, networked ideas, and procedural but nonverbalizable ideas greatly affect navigation speed and comprehensibility.
Core Concepts of Working Memory
- A person can hold 3 to 5 items in working memory.
- Items can be any “chunk” of data: a word, a digit, an image, or a sound.
- More complex chunks are storable as single items, such as a pathway, or a phrase.
Add another item, and one of the other items on the list likely falls out.
1) Any topic that remains in working memory will reduce available memory.
This includes anxiety that the app will misbehave or cause a loss of data.
2) Four actions within a process or in the perceptual span path is a safe length
You can have long lists outside of a process, where scanning is the process.
If it’s in process and you must have more than four actions, bundle actions.
3) Use chunking efficiently by using higher information chunks
Save & Quit takes up less mental space than Save…. \n Quit…
Use combined words, repeated phrases, image or visual data.
Interfaces that require users to routinely exceed their working memory while in the middle of a process, such as reading, writing, creating or organizing, will frustrate learning, and in learned users, will cause context switching as they recall from longer term memory.
Networked knowledge and procedural knowledge are key aspects of how experts perform actions quickly.
If you are building the product, you have this knowledge. Your newest users might not.
Procedural knowledge lets a series of reflexive or motor-based actions accomplish an intent. The individual steps to accomplish a task (ctrl+shift+s = save) or (two finger swipe down from top of screen = quick settings) do not occupy working memory when the knowledge is procedural.
Networked knowledge allows a single chunk of data to be traversed quickly, reducing the impact of context switching. Logout is linked to account, account is linked to me, my user icon is in the upper right.
Interface that wipe or clears the visual state and causes the user to need to revisit an area (e.g, paginated controls, especially deeply nested paginated controls with a high degree of similarity spread into separate areas) can introduce significant delays and, ultimately, frustration.
Expert users experience impacts and drawbacks whenever their networked or procedural expertise no longer works correctly, or produces an unexpected result, reducing their trust and expectations.
Deep procedural and networked knowledge can make a realistically dense and impenetrable experience seem familiar and easy, even if the activity involves a lot of novel actions.
Unchecked or unexamined, this can lead us astray in building up the experiences of new users who did not “grow with the software,” and lead to unnecessary dilemas such needing to choose between an interface redesign that subverts expertise but benefits new users, or worse, to a redesign that benefits neither.
User preferences and learning strengths will govern how quickly they assemble networked and procedural knowledge and in what order. Stress reduces learning speed.
A strong design focus on maintaining design points that aid users in translating working memory experiences into Long Term Memory will keep the pipeline for new users to long term users moving smoothly.
Mapping the specific growth paths of user experience to direct aspects in a legible manner is important to the long term health of the application, and the productivity of the team: if new hires are not catching up to established expert usage practices, interface design and verification will suffer, and senior staff can lose sight of the novel experience.
What you see is not what you perceive
Blindspots and foveal acuity are not the only factors that limit perception.
We might say that each eye represents a connection that can transmit 100 Mb every second.
The visual system will discard or simplify the vast majority of input.
A human asked to describe a scene they “perceived” for a second would not likely recall more than a paragraph of text after a minute of work – some 200 to 300 bytes of data.
The underlying physiology did not change, but our understanding updates all the time.
Therefore, an enormous amount of selective attention, combination, encoding, and culling must occur to compress data to a workable stream for conscious human thought.

To allow the human mind to operate efficiently on the information it receives, first Iconic Memory, then the VSTM, and then Working Memory begin linking color, texture, size, boundaries, motion into distinct objects.
Object Individuation
After features are created, they can be selected for Individuation during the Visible Persistence (125 ms +/- 25ms) phase of Iconic Memory. A failure to individuate an object means it will not enter memory.
For example, if asked to name items in a living room, many people might identify a lamp or a desk, but draw a blank when asked for the color of the walls or the number of teacups on a table or the number leaves on a branch outside. Broad areas with limited distinctive features are rarely selected over objects with many distinct aspects.
Visible Persistence is disrupted by voluntary blinks and larger saccadic eye movement, including from reflexively glancing away or toward a distractor. Objects larger than a user’sperceptual width for that type of object must draw on later processes in the visual cortex.
Typically, the human mind cannot subitize more than 2-4 items into objects for the Informational Phase of Iconic Memory. Competing theories exist for whether they are instantaneously assessed into limited slots, or temporally assessed at a rate of about 25ms each.
Visual stimulus with strong similarity become grouped: birds traveling in the same direction are likely Individuated as a single Object flock. Similarly, a series of similar looking cursor icons next to a circle and a square become “Cursors”, “Circle Tool,” and “Square Tool”.
Object Identification
Objects that are individuated, i.e, they are distinct from one another to the viewer, can then further be selected for Object Identification as part of VSTM, where feedforward interactions link the object to past knowledge about that object either from Working Memory or LTM.
Objects that fail to be identified are not typically available for conscious thought regarding action.
For example, a person might recognize an icon for Saving a File, but fail to recognize the icon for Export to PDF, leading to confusion.
As part of being loaded into VSTM, Objects are increasingly distinct with many bound features, and details about the ground are lost. Visually, they become separated by gaps, not detail, and their exact distances and orientation to other individuated objects is lost.
Once loaded into VSTM (500 to 1500 ms) the person in our room example might recall “My Cup” was on the table next to “Other Cups,” but not which Other Cup was closest, a feat they would be able to accomplish during the earlier Visible Persistence phase of Iconic Memory.
It is possible to overload a viewer’s VSTM by increasing the flow and quantity/quality of information. An overloaded VSTM will
Object Integration
From Visual Short Term Memory (VSTM), objects can enter the Working Memory for integration with visual and non-visual queues, including memory retrieval and creation.
During this stage, audio short term memory, verbal rehearsal, and other sensory information can also be held in Working Memory. Note that capacity may be impacted when the data types rely on similar systems, e.g, when performing a spatial search, spatial information about other objects is reduced, but information about color and size are retained. Similarly, rehearsed non-verbalized articulatory instructions from phonological memory (approximately 2s of speech) don’t compete with visiospatial data, but they do compete with and suppress other articulatory instructions.
Saliency Mapping & Saliency Guides
Earlier, we expanded on the theory of Acuity Maps for what the eye can see and in what detail.
Similarly, the mind continually updates its own Saliency Mapping that contains both locational information from visual stimulus and object-based maps of what objects and areas are interesting and which ones can be flushed from memory.
Saliency Mapping can be considered to exist across the whole visual field, and, contrarily, in isolation on distinct specific areas.
Unlike an Acuity Map where we know exactly what is in the visual field of the average human on a given display, making a Saliency Guide is all about where and why we provide hints, contours, and context to help a user sequentially guide their attention.
Constructing a Saliency Guide for any application should consider the limitations of human processing, human perceptive timing and capacity, and the reflexive Inihibition of Return (300 ms) generated by the Superior Collicus to already searched areas.
A saliency map to a computer or in a machine learning context is a map of the most relevant pixel coordinates to the context of an image and is often an output or intermediate output in a process to identify points of interest, and the body of research work behind the cognitive aspects of human vision are an important foundation for some visual LLM work.

Seen above, a generated saliency map generated from color, intensity, and orientation.
Applying this concept produces useful information for software, but renders the image unrecognizable to human minds, showcasing the degree to which human perceptual systems are distinct from massively parallel computer vision systems despite many similarities.
For humans, several other processes have already greatly removed the retinotopic projection and topographic data that we would associate with a color / coordinate based imaging system. Each user saliency mapping will, in fact, be distinct to that user in that moment.
Saliency for humans is more about the priority sequence of objects they will encounter.
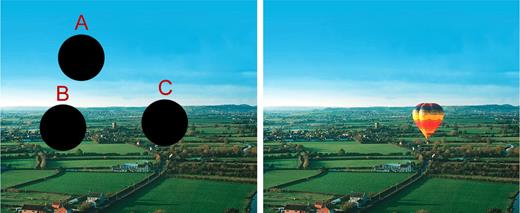
Seen in isolation, the least predictable area of this image is Area C, and therefore area C is expected to have high Saliency to the user’s interest.
However, attention by definition is a moment-to-moment process shaped in each user’s brain individually: told to search for a lake, Area C (viewed at a larger size) is no longer salient to the user’s intent and is now a distractor.
Working Memory gives us a limited number of items (typically, not more than 4-6 items), not just visual, that can be held in memory and worked on. Working memory is continually updated, with a full working memory discarding the least useful though
Iconic Memory provides a high bandwidth, high capacity, rapidly decaying visible persistence store. The visible persistence phase lasts for no more than 150 ms, and can be cleared by saccades, blinking, or time.
Perhaps surprisingly, it is shorter exposures to a visual stiumulus that provide visibile persistence within Iconic Memory closer to the 150ms limit, not longer exposure. This is why a quickly glimpsed object can remain in memory longer than a scene where the viewer had no interest in, despite viewing it for longer, and why if internal rehearsal is suppressed, longer time to study an input does not necessarily
In the earliest levels, visual stimulus can be mapped from exact locations on the eye to general locations in the brain’s Visual Cortex (flipped upside down for the mirror effect of our eyes, then flipped from the left eye to the right brain, etc). At this stage, the brain has information about color, comparable in some ways to how a display has information about what color a specific LED is.
Visual Masking occurs at the level of Iconic Memory to combine shapes occupying the same physical space
At higher levels, visual data increasibly ceases to be an abstract pattern linked to exactly
Our goal in Interface Design is not generally to force as many objects as possible into a user’s VTSM. Our goal is the right ones at the right time.
Even taking those into account, the information that could reach our perceptive system represents too large of a data set for the human mind to operate on effectively.
Peripheral interfaces and lateral interference
Finally, we move into greater detail on the attentional aspects of visual perception, and why areas may selected for the recognition of abstract shapes and colors into things, and how design and user experience are affected by these processes.
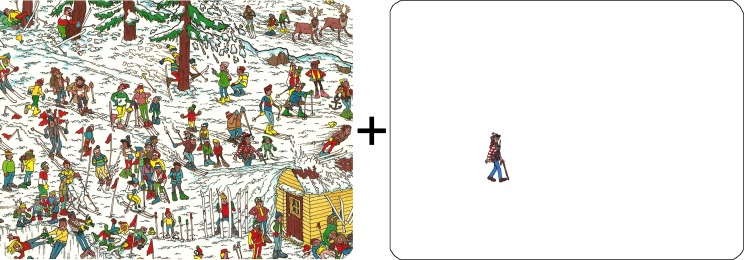
“Crowding demo. In the cluttered scene (left panel), Waldo is impossible to identify while fixing your eyes on the plus sign. Removing the clutter reveals Waldo. This is not an acuity problem; it is crowding.”
https://pmc.ncbi.nlm.nih.gov/articles/PMC4527718/
The phenomena of Visual crowding, which is exhibited above, provides us with considerations about peripheral UI.
Visual Crowding is distinct from:
1. Visual Masking (an Iconic Memory interference caused by sequencing items in the same retinoscopic area)
2. Repetition blindness (a VSTM optimization that consolidates and culls unnecessary data from recongized objects, i.e, the reason ‘the the’ is often missed as a typo)
3. Contour Interference (a failure of feature detection and object individuation: in the image above, most figures are clearly individuals)
Instead, Visual Crowding is likely a failure outcome for Spatial Search when Inhibition of Return paradigmes and other mental processes for performing a search fail.
How close is too close?
To avoid the “waldo situation” of a UI item being made “invisible,” we must consider the distance from the center of the gaze the UI element will typically reside to calculate the optimum spacing, and weigh it against the limitations of available space.
Visual crowding presents enhanced problems for new users, who do not yet possess the visual memory of the object location.
Spatial search is also inhibited by mirror symmetry and structures consisting of identical counts of segments.
Because items confined to the foveal arc is largely unaffected by Visual Crowding, and because the critical threshold for Visual Crowding is greater the further the object is from the center of the gaze, our focus in Crowding Analysis is often grouped iconography instead of individual items. Thus we are primarily concerned with peripheral UI elements.
Other factors that negatively affect perception of objects include mirror symmetry and structures consisting of identical counts of segments, both of which impedes feature detection.
Visualizing crowding
Crowding Simulator:
https://lampwrite.com/examples/crowding-simulator/clocks.html
Because the critical distance between objects increases the further it is from the center of the gaze, we’ve constructed a visual simulation scenario (select Bouma Crowding) to illustrate the impacts.
A summary of applications
With knowledge of the width of perceptual span, we can derive nominal sizes for
- vertical menus
- horizontal menus,
- thumbnail size,
- button dimensions,
- indentation
To ensure our interfaces maximize the usage of iconic memory without overflowing it.
With knowledge of the saccade systems and an understanding of thresholds in it, we can determine
- Comfortable reading width
- Where diagonal saccades interfere with processing and where they will enhance
- Where animation matters most and why
We can build those systems to avoid impairing visual acuity at key points, confounding a user’s visually guided saccades, triggering multiple corrective saccades, or generally interrupting or making their ability to process content and interface challenging.
Smooth pursuit gives us an understanding of when and under what conditions humans exceed the threshold of the saccade system (education, interaction, and visually creative exercise) and begin benefiting from higher resolutions, higher framerates, and certain types of designs for less involved interaction begin to be counterproductive. It is here we must apply the most attention to optimization and consistent performance.
Through our knowledge of the foveal structure, where vision is dominated by cones instead of rods, we know the while the human eye drops visual acuity outside of the fovea, it gains better ability to perceive faint objects. This allows faint design elements to play an elevated role in parafoveal and peripheral processing without exceeding comfortable information thresholds.
Closing considerations for the future
The physiological aspects of perception, especially at the macular level, have clearly defined capacities that can be directly mapped to UX and interface design at all levels of consideration.
The concepts of Iconic and Visual Short Term Memory and the mechanics of the eye inform us that we are not just making applications and interfaces that are convenient for a machine to execute, but in particular, for another, complex and varied system of human consciousness to engage with.
In another article, we’ll explore the flow in the opposite direction from perception: how a user’s Long Term Memory informs their experience, alters and reshapes what they perceive and how they see it, shapes their expectations and ultimately informs their joy with the application.
APPENDIXES
Fundamentals of Sizing for Web
A PRIMER ON PROPERLY MAPPING PIXELS TO REAL WORLD MEASUREMENTS AND VISUAL ARCS
Have you wondered about why “12 pt” font in a word document looks different on a website, why a font size that was just a little small on a desktop became difficult to read on a laptop, and why printing web documents can sometimes have unpredictable results?
Sizing across screens is dependent on non-obvious properties and does not obey print rules. A working knowledge of sizing is important to Acuity Mapping and achieving pixel-perfect layout.
The most important aspect is that CSS does not actually have real-word measurements. The units “mm” and “in” are purely pixels. 96 pixels per inch and 3.78 pixels per mm, with no attention to screen size.
Compare that to Word or Photoshop, where a 12 pt font is always the same size, no matter what size of paper you print on or size of monitor you view it on.
Because real sizes are often used in native applications for images and print, if we embed images or documents, we have to keep in mind that 12 pt font in photoshop is not necessarily equivalent to 12 pt once converted to web context.
That means measurements given in “inch”, or “mm” are converted to hardcoded pixel measurements by the browser. Their actual physical size in pixels depends on the screen size, and there is limited utility to using these sizes.
Similarly, even the “pt” fonts in CSS are themselves set to 1/72ths of an “inch”, which are in turn expressed in 1 inch per 96 pixels. E.g, specifying “9 pt” means, functionally, 12px.
You can see this by first convert the pts to inches and then the inches to pixels.
$$9pt * \frac{72}{96} = 12 px$$
Or, to simplify the conversion factor, 9 pt / 0.75 = 12px.
All pt, in, and mm measurements are reduced to pixels
| pt | px | “in” | “mm” |
| 9 pt | 12 px | 0.125 in | 3.175 mm |
What does that do the size of those elements on different monitors?
Let’s compare desktop applications with screen size awareness, print, and web applications for a “9 pt” font for a monitor at 1920×1080 pixel:
| real size 24″ | real size on 32″ | real size on 15″ | real size on 22.95″ |
| 0.131 ” tall | 0.174 ” tall | 0.082 ” tall | 0.125 ” tall |
| 4.64% difference | 49.44% difference | -34.64% difference | 0% difference |
|
12pt
|
12pt
|
12pt
|
12pt |
| Real ” on 24″ screen | Real ” on 60″ tv | Real ” on an A4 | Real ” on a 10ft banner |
| 0.125 “ | 0.125 “ | 0.125 “ | 0.125 “ |
| 0% difference | 0% difference | 0% difference | 0% difference |
Only a 96 dpi screen, e.g, a screen exactly four inches wide with a resolution of 384 (4*96) pixels, will have units that match their physical size.
That’s actually somewhat uncommon – mobile phone manufacturers moved away from hitting exactly 96 DPI more than 10 years ago, and a typical 24″ diagonal monitor at 1920×1080 has a DPI of about 91px, with 27″ monitors reaching 86 DPI or 104 DPI depending on their resolution.
Prior to 2011, the spec for CSS and HTML did specify that real measurement units should be displayed as their physical size. However, most browser vendors were not compliant with the spec, and eventually the spec was rewritten to reflect that reality.
All major browsers do not currently provide the user’s real screen size and it cannot be calculated through other properties. For example, while a DPI (Pixels Per Inch) is often provided, it’s not a ‘true’ DPI and is instead just a hardcoded 96 DPI, or another hardcoded value for retina or high-ppi screens. Calculations performed using this hard-coded value will be incorrect in almost all cases, and sometimes in a preposterous manner (reporting a 10 inch screen as 20 inches, etc).
We can prompt the user to enter the size of their screen and then calculate DPI. This is useful in digital signage, print and true-to-life creative applications, visual sciences, and, of course, for performing visual analysis of UX performance. Thanks to CSS var(), we only have to do this once.
Such an example is provided in the crowding-simulator.
For native applications, including Electron packaged web applications, we can retrieve the true screen size from display drivers or utility functions.
For yet further complexity, the pixel dimensions on a number of mobile phones after 2015 no longer correspond directly to exact pixels, but are rather interpreted to a display port size, such that, e.g, a Samsung 2340 x 1080 is expressed at a DPR of 3.0, meaning the display treats pixels as 780×360.
There exist a separate set of techniques for leveraging the higher pixel density for photos.
In general, due to the pressure of usability concerns, you can safely assume that a user’s screen will be somewhere between 85 pixels per inch and 105 pixels per inch.
In conclusion, absent a native app context or prompted sizing, design on the assumption that any element you specify a size for will have a variability of plus or minus 12% in real size on a user’s screen. If not designing within that safe threshold, it becomes useful to ensure the user has retained the ability to reliably increase or decrease the page size without interference.
SOURCES
We’ve reviewed the cited articles and their methodologies.
Cited below in bold is a short summary of the research examined in this article, with a primary topic in bold (our words) and in quotations the verbatim conclusion of the linked author, followed by an active, working link to their publication.
Most articles are open access. Contact us for the few that are not if a permanent copy is desired.
Iconic Memory and Visual Span topics
-
- Perceptual window is larger for faces than text : “The Facespan—the minimum spatial extent of preserved facial information leading to comparable performance as in natural viewing—encompasses 7° of visual angle in our viewing conditions (size of the face stimulus: 15.6°; viewing distance: 70 cm), which represents 45% of the face.”
-
- https://jov.arvojournals.org/article.aspx?articleid=2629823
-
- Perceptual window is larger for faces than text : “The Facespan—the minimum spatial extent of preserved facial information leading to comparable performance as in natural viewing—encompasses 7° of visual angle in our viewing conditions (size of the face stimulus: 15.6°; viewing distance: 70 cm), which represents 45% of the face.”
-
- Iconic Memory & Complexity: “Simplified Chinese Visual Span is 5 characters; TCM is 3 characters”
-
- Iconic Memory & Complexity: “Uyghur, which uses a non-latin alphabet of similar visual complexity to latin1, the visual span matches English, German, Finnish and other latin1 alphabets at the previous 5 and subsequent 14 letters”
-
- High distinction elements within an iconography create navigational ease: “Kanji-kana mixed texts, which have no spacing, results in Kanji characters being used as a navigational aid. In this context, they obtain a greater visual span.”
-
- Vertical perceptual span: “readers visually attend to useful text layout features while considering bigger units than single text lines. The perception of topic headings located away from the fixated line may favour long-range regressions towards them, which in turn may favour text comprehension.”
-
- Static Detection (>240ms: “Static detection (≥240 ms). Information carried by the feedforward “wave” created by the appearance of an item reaches high levels relatively quickly. After a brief time (c. 100 ms), access to high-precision spatial information in the low iconic layers begins to degrade. But since detection does not require precise spatial information, it can still be “driven” by the information at the higher layers of iconic memory for several 100 ms longer.”
Physiology of the Eye
-
- Blind spots transitions are actually gradual: “These data show that the transition from full visibility to blindness at the blind spot border is not abrupt but occurs over a broad area.”
-
- Blind spots at 15-20 degrees from fixation: “Located approximately 15 to 20 degrees in the temporal periphery, it corresponds to the region on the retina at which the optic nerve leaves the eye and no photoreceptors exist. It has a roughly oval shape given by the optic disc, the optic nerve head, and ranges in length from 5 to 7 on the horizontal meridian and from 7.5 to 10 on the vertical meridian”
-
- Blind spots at 12-17 degrees from fixation: “Situated in the temporal hemifield is the normal blind spot approximately 12 to 17 degrees [centered at 15] from fixation and 1.5 [2° 10`?] degrees below the horizontal meridian. The blindspot is represented on a visual field chart by an absolute scotoma and corresponds anatomically to the scleral canal through which the retinal nerve fibers leave the eye at the optic disk.”
-
- 10 to 25 degrees horizontal radially has relatively consistent visual acuity: “Note the performance plateau on the horizontal meridian between 10° and 25° (between the 3% and 4% line), similar to the one found in perimetry (Harvey & Pöppel, 1972; Pöppel & Harvey, 1973).
-
- Physically: umbo 0.15mm 1°30`, foveola 0.35mm 1°30`, foveal avascular 0.5mm 1°40`, fovea 1.5mm 5°, parafovea 2.5mm 8°40`, macula 5.5mm 18°20`
-
- The boundary of foveal and parafoveal is a curve: “The resolution of the visual system drops off from the fovea into the periphery gradually rather than with sudden transitions (Loschky et al., 2005), but for descriptive convenience, researchers commonly divide the visual field into three major regions: foveal, parafoveal, and peripheral. In visual-cognition research, the foveal region is considered to extend from 0° to 1° eccentricity and the parafoveal region from 1° to 4–5°, whereas the peripheral region encompasses the remainder of the visual field (Larson & Loschky, 2009; Loschky et al., 2019). The fovea and parafovea together are oftentimes referred to as central vision, whereas extrafoveal vision comprises the parafovea and the periphery.”
-
- The degrees of sharp central vision vary depending on how you calculate them:
-
- Foveola is 1.33 degrees of vision: “The ‘foveola’ is the central 250–300 μm, and represents the central 1°20′ of the visual field. It is slightly more than 100 μm thick and is formed only by cone outer and inner segments, a tightly packed 10–12 deep layer of cone cell bodies (Figures 2(a) and 2(c)), and surrounding Müller glial cell processes. All other layers are displaced peripherally by the pit. The foveola is the region of highest cone density so that foveolar cones are very thin and long and have the longest inner and outer segments in the retina (Figures 2 and 3). Rod photoreceptors are absent.“
-
- The Fovea is 2° of vision: “The foveal region comprises 1° to the left and right of fixation and has the best acuity; here letters can be identified easily. The parafoveal region comprises the 4° to the left and right of the foveal region.”
-
- The Fovea is 2° of vision: “The foveal region comprises 1° to the left and right of fixation and has the best acuity; here letters can be identified easily. The parafoveal region comprises the 4° to the left and right of the foveal region.”
-
- The fovea is 5.5 degrees of vision: “The next ring is the ‘fovea,’ which extends 750 μm around the foveola. The fovea covers 5.5° of the central visual field. Cone density is lower than in the foveola, and cones are thicker. Rods are present at low density in the fovea.“
-
- The fovea is 5.5 degrees of vision: “The next ring is the ‘fovea,’ which extends 750 μm around the foveola. The fovea covers 5.5° of the central visual field. Cone density is lower than in the foveola, and cones are thicker. Rods are present at low density in the fovea.“
-
- The third ring is the ‘parafovea,’ which is ∼500 μm wide.
-
- The outermost ring is the ‘perifovea,’ which is ∼1.5 mm wide and extends almost to the optic disc (Figure 1). These zones do not have sharp morphological boundaries. Rods are more numerous in the parafovea (Figure 2(c), R) and cones are thicker and less numerous. In the perifovea rods are the dominant photoreceptor and the GCL decreases to one to two cells thick near the optic disc.
-
- Light scattering is minimized within the foveal pit: “Another anatomical feature of the fovea (which literally means “pit”) that contributes to the superior acuity of the cone system is that the layers of cell bodies and processes that overlie the photoreceptors in other areas of the retina are displaced around the fovea, and especially the foveola (see Figure 11.11). As a result, light rays are subjected to a minimum of scattering before they strike the photoreceptors. Finally, another potential source of optical distortion that lies in the light path to the receptors—the retinal blood vessels—are diverted away from the foveola.”
-
- Low amplitude saccades enhance transitions: “Foveal processing of saccade targets commences before the movement is executed and thereby enables a seamless transition once the center of gaze reaches the target.”
-
- Peripheral and foveal vision are intricately related: “Overall, a clear picture of a highly integrated visual system emerges, in which the differences between peripheral and foveal vision are reconciled by a diverse array of mechanisms:
-
- during fixation, peripheral vision is enhanced by using foveal feedback signals for object recognition
-
- by extrapolating information from the fovea toward the periphery;
-
- a transsaccadic learning mechanism calibrates peripheral and foveal percepts;
-
- information from peripheral and foveal vision can be integrated across saccades to optimize the uptake of information.”
-
- Peripheral and foveal vision are intricately related: “Overall, a clear picture of a highly integrated visual system emerges, in which the differences between peripheral and foveal vision are reconciled by a diverse array of mechanisms:
-
- More than 50% of sensory receptors are in the eyes: “More than 50% of the sensory receptors in the human body are located in the eyes, and a significant portion of the cerebral cortex is devoted to interpreting visual information.”
VSTM
-
- VSTM can maintain representation from 500ms to 1-2s with attention: “Performance declined exponentially with longer storage durations and reached chance levels after ∼2 s. Further experiments showed that performance for the 10 items at 1 s was contingent on unperturbed attentional resources. In addition, for orientation stimuli, performance was contingent on the location of stimuli in the visual field, especially for short cue delays. Overall, our results suggest a smooth transition between an automatic, high-capacity, feature-specific sensory-iconic memory, and an effortful “lower-capacity” visual working memory.”
-
- VTSM capacity and efficacy is plastic: “Visual short-term memory (VSTM) is limited, especially for complex objects. Its capacity, however, is greater for faces than for other objects, an advantage that may stem from the holistic nature of face processing. If the holistic processing explains this advantage, then object expertise—which also relies on holistic processing—should endow experts with a VSTM advantage. We compared VSTM for cars among car experts to that among car novices. Car experts, but not car novices, demonstrated a VSTM advantage similar to that for faces; this advantage was orientation-specific and was correlated with an individual’s level of car expertise. Control experiments ruled out accounts based solely on verbal- or long-term memory representations. Visual experts process highly complex objects within their domain of expertise with relative ease“
Cognitive perception
-
- Focus vs Concentation: “While focused attention refers to the ability to selectively attend to parts of all incoming stimuli (like a “spotlight”; Heitz & Engle, 2007), concentration refers to the degree of attentional engagement (Hughes, Hurlstone, Marsh, Vachon, & Jones, 2013; Linnell & Caparos, 2013).
-
- Concentration is not effort: “Concentration is also related to but distinguishable from effort (Sarter, Gehring, & Kozak, 2006) and motivation (Engelmann, Damaraju, Padmala, & Pessoa, 2009). While the latter two concepts refer to the deliberate attempt to try harder, higher levels of concentration do not necessitate greater effort (although concentration and effort often go hand in hand, such as when higher task difficulty is compensated for). An expert player of a non-physical game, for example, may reach high states of concentration without much effort.”
-
- Concentration Shields Against Distraction: “Concentration shields against distraction because:
-
- (a) undesired processing of the background is reduced and
-
- (b) the locus of attention becomes more steadfast.
-
- We believe these two mechanisms are separable; the former is associated with active suppression or inhibition of distraction, the latter with distracter blocking as a consequence of greater facilitation of attention to the attended stimulus”
-
- “In support of this assumption, both perceptual load (Forster & Lavie, 2009) and high WMC (Kane & McVay, 2012) appear to protect against mind wandering and task-unrelated thoughts.”
-
- Concentration Shields Against Distraction: “Concentration shields against distraction because:
Audio memory and phonological loop
- Duration of self-instruction is 2s: “The phonological store is a passive buffer in which speech-based information can be stored for brief (approximately 2-s) periods. The articulatory control process serves to refresh and revivify the contents of the store, thus allowing the system to maintain short sequences of verbal items in memory for an extended interval. This division of labor between two interlocking components, one an active process and the other a passive store, is crucial to the model’s explanatory power.”
- Rehearsal is sensitive to interference of other rehearsals: “For instance, when the articulatory control process is interfered with through the method of articulatory suppression (e.g., by requiring subjects to say ‘hiya’ over and over again), items in the store rapidly decay, and recall performance suffers greatly. The store, then, lacks a mechanism of reactivating its own contents but possesses memory capacity, whereas, conversely, the articulatory rehearsal process lacks an intrinsic memory capacity of its own, but can exert its effect indirectly by refreshing the contents of the store.”
Flicker Fusion Thresholds and Visual Phenomena
-
- 500 Hz when stationary: “The human eye can detect flicker at 50–90 Hz but reports are showing the possibility to distinguish between steady and modulated light up to 500 Hz.”
-
- 2000 Hz during movement: “In some cases, it is possible to see flicker at rates beyond 2000 Hz (2 kHz) in the case of high-speed eye movements or object motion, via the “phantom array” effect. Fast-moving flickering objects zooming across view (either by object motion, or by eye motion such as rolling eyes), can cause a dotted or multicolored blur instead of a continuous blur, as if they were multiple objects. Some special effects, such as certain kinds of LED glowsticks, commonly seen at outdoor events, have the appearance of a solid color when motionless but produce a multicolored or dotted blur when waved about in motion. The variation of the duty cycle upon the LED(s), results in usage of less power while by the properties of flicker fusion having the direct effect of varying the brightness. When moved, if the frequency of duty cycle of the driven LED(s) is below the flicker fusion threshold timing differences between the on/off state of the LED(s) becomes evident, and the color(s) appear as evenly spaced points in the peripheral vision.”
Smooth Pursuit Topics
The metrics of smooth pursuit eye movements. These traces show eye
movements (blue lines) tracking a stimulus moving at three different
velocities (red lines). After a quick saccade to capture the target, the
eye movement attains a velocity that matches the velocity of the
target. (After Fuchs, 1967.)
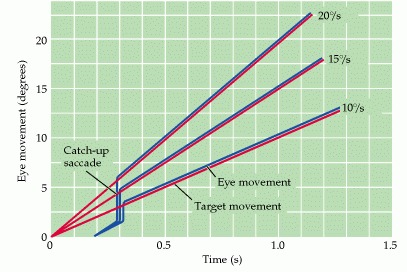
-
- Smooth Pursuit matches target velocity precisely: “Smooth pursuit movements are much slower tracking movements of the eyes designed to keep a moving stimulus on the fovea. Such movements are under voluntary control in the sense that the observer can choose whether or not to track a moving stimulus. Only highly trained observers can make a smooth pursuit movement in the absence of a moving target.”
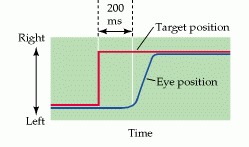
Saccade Topics
The metrics of a saccadic eye movement. The red line indicates the position of a fixation target and the blue line the position of the fovea. When the target moves suddenly to the right, there is a delay of about 200 ms before the eye begins to move to the new target position. (After Fuchs, 1967.)
-
- Visual processing is disrupted during saccades through saccadic masking : “
-
- Voluntarily blinking suppresses iconic memory: “We propose a new phenomenon, cognitive blink suppression, in which blinking inhibits cognitive processing. This phenomenon may be due to neural interference.”
-
- https://link.springer.com/article/10.3758/BF03193691
-
- Voluntarily blinking suppresses iconic memory: “We propose a new phenomenon, cognitive blink suppression, in which blinking inhibits cognitive processing. This phenomenon may be due to neural interference.”
-
- Saccade Timing: “The initiation of a saccade takes about 200 milliseconds. Saccades are said to be ballistic because the movements are predetermined at initiation, and the saccade generating system cannot respond to subsequent changes in the position of the target after saccade initiation.
-
- Missing a beat: “If the target moves again during a saccadic movement, (which is on the order of 15–100 ms), the saccade will miss the target, and a second saccade must be made to correct the error.
-
- Prosaccades: “Prosaccades involve the simple redirection of gaze to a stimulus and typically are generated to align the fovea with visual targets of interest. These are visually-guided saccades that do not involve complex volitional processes.
-
- Predictive saccades: “Predictive saccades occur when gaze is fixated on a target moving in a temporally or spatially predictive manner.”
-
- Memory-guided saccades: “Memory-guided saccades occur when the eyes move toward a remembered point with a prior visual stimulus.”
-
- Saccadic masking prevents perception of smearing: “Visual information during saccades is considered to be “masked”, or hidden from our perception. Saccadic masking explains why we do not perceive a smeared out image or disturbing sense of motion during each saccade. This phenomenon is due to an entirely visual process and involves suppression of the magnocellular pathway, which is involved in carrying information about motion at high velocities.”
-
- Horizontal saccades: “The paramedian pontine reticular formation PPRF […] mediates horizontal saccades” & “…a saccade initiated in the left frontal eye field will activate the left superior colliculus, which will cause downstream activation of the right abducens nucleus and left oculomotor nucleus, allowing horizontal movements of both eyes to the right.”
-
- Vertical saccades: “The vertical gaze center, or rostral interstitial nucleus, sends its axons bilaterally to the trochlear and oculomotor nuclei […]. the torchlear nuclei then activates the superior oblique muscles, and the oculomotor nuclei control the inferior oblique, inferior rectus, and superior rectus muscles.”
-
- Saccades > 20 result in hypometria: “After the age of 50, saccades greater than 20° had hypometria exceeding 20%. Small saccades (<5°) were not nearly as significantly affected.”
-
- Saccade processing in youth: “Under the age of 20 there was a tendency to overshoot target steps less than 10° and to undershoot target steps greater than 10°”
Perceptual Speed Topics
-
- Picture recogniton at 13ms: “[…] Conceptual understanding can be achieved when a novel picture is presented as briefly as 13 ms and masked by other pictures. Even when participants were not given the target name until after they had viewed the entire sequence of six or 12 pictures, their performance was above chance even at 13 ms, indicating that a top-down attentional set is not required in order to rapidly extract and at least briefly retain conceptual content from an RSVP stream. The numbers of pictures in the sequence and their serial positions had little effect on performance, suggesting that pictures were processed immediately rather than accumulating in a limited-capacity memory buffer for subsequent processing. This pattern of results supports the hypothesis that feedforward processing is sufficient for the conceptual comprehension of pictures.”
Memory Topics
-
- Working memory is 3 to 5 items: “The ability to repeat information depends on task demands but can be distinguished from a more constant, underlying mechanism: a central memory store limited to 3 to 5 meaningful items in young adults.”
-
- Chunk capacity: “Here we show that there is an approximately constant capacity of about 3 chunks, regardless of list length, provided that covert verbal rehearsal is suppressed, and participants are not held responsible for serial order information.”
-
- Exceeding working memory threshold slows learning: “In comprehension of an essay, one might have to hold in mind concurrently the major premise, the point made in the previous paragraph, and a fact and an opinion presented in the current paragraph. Only when all of these elements have been integrated into a single chunk can the reader successfully continue to read and understand. Forgetting one of these ideas may lead to a more shallow understanding of the text, or to the need to go back and re-read.”
-
- Networked knowledge improving recall: “The memory advantage of learned pairs is not fully explained by assuming that they include twice as many retrieval cues as do singletons. The pair conditions, in which 72.9% of the words were recovered from long-term memory, in fact showed more than double the performance of the singleton conditions, in which only 26.0% of the words were recovered from long-term memory. If new semantic connections were formed between arbitrarily paired words during training, the long-term representation of learned word pairs may have benefited from deep processing.”
A word of caution on accepting results at face value
From the April 2024 Journal of Vision:
It is a single number for which our 80-page review for peripheral vision has been repeatedly cited: the lateral horizontal extent of the visual field. We said it is about 90° of visual angle from the point of fixation. This number is wrong—the actual extent is much larger.
How could this gross error arise? We were not alone with this misconception; it is widespread in the scientific literature and in textbooks (for a review, see Strasburger, 2020). Curiously, although a correct estimate has been known since Purkinje (1825), (cited after Wade, 1998), and is even seen in a drawing from Leonardo da Vinci (da Vinci’s Manuscript D from ∼1514; Wade, personal communication),
[…] the rather limited estimate of 90° arose during the 1980s. A likely reason is the widespread use of cupola perimeters, in conjunction with the influential operational definition of the visual field by Aulhorn and Harms (1972, p. 103) as “the field of functional capacity obtained and recorded by means of perimetry.” In this view, the term “visual field” does not refer to the maximum field visible but rather to the sensitivity profile, obtained for ophthalmic diagnostic reasons, within these perimetric limits. This difference in meaning has been overlooked by those relying on the 90° border seen in standard perimetric maps.
It is important to pay attention to when a published article makes a statement that seems like it might be inaccurate. Humans have known that peripheral vision extends greater than 90 degrees for at least six hundred years, which can be simply demonstrated by holding our hands up slightly in front of our ear while gazing forward.
However, reliance on a particular tool in the 1980s and graphs intended for medical usage, not scientific, propagated a major uncertainty into the literature that continued to persist for more than forty years.
Just as Potter et al (cited earlier) produced a study that took a conventional ‘wisdom’ – that humans could not perceive distinct images at values larger than the saccade threshold of 100ms – the reason often came down to something quite simple: more recent scholars chose commodity setups with limited framerates, rather than older technology with a faster refresh rate, or newer technology that had caught up.
In this case, too, there was an established body of research showing image recognition at below 28ms, e.g, by Thorpe et al at least as early as 2001, but the popular literature described this the 2016 finding as a novel discovery.
The underlying physiology did not change, but our understanding updates all the time.